Be patient in bull market
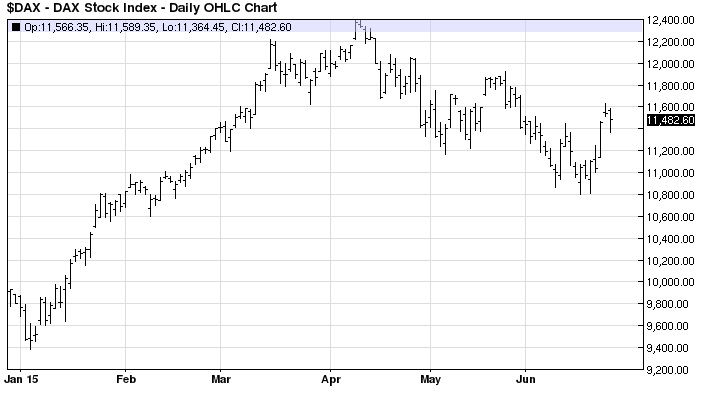
Several major stock indexes such
as S&P, DAX and FTSE had made a new historical high recently. It is due to
global easing and growth reacceleration. However, many ask the question this
moment “Are we close to bull market top?” My answer is No. Firstly, I express
my view that US or the developed markets still is on the uptrend this year. Noteworthy,
I am bearish in this moment intermediately and expect a pullback or correction
is coming soon but it will bring an opportunity to take a long position. It is unwise
to follow an over optimistic and stretched rally now.
Figure 1: The latest NNAIM
Exposure Index reaches 99.2 that is 99th percentile. It reveals money
managers are extremely optimistic towards stock market.
Source:
Pension Partners
Figure 2: AAll Sentiment (Bull-Bears)
is close to optimistic level.
Source:
Pension Partners
Figure 3 and 4: Investor
Intelligence Sentiment (Bull-Bears) also hit a extremely optimistic level which
is 99th percentile and the forward S&P return is disappointed.
Source:
Pension Partners
Figure 5: Percent of S&P
member above 50 days moving average has a divergence to SPX that make a new
high. Worsening breadth show the rally is losing momentum now.
Source:
StockChart.com
Figure 6: In average, the number
of over 5% decline in S&P is roughly 2 times a year. Since the intermediate
bottom in mid-Oct, market never has an over 5% pullback. I expect a pullback is
coming soon because the rally had taken over 4 months to go.
Source:
Bloomberg
Figure 7: Conference Board LEI
still is on the uptrend and 6 month Diffusion Index stay above warning level.
Economy is unlikely to entre recession.
Source:
Conference Board
Figure 8: High Yield Bond
Spread improves at the beginning of 2015. Credit Market performance reflect its
health.
Source:
Bloomberg
Figure 9: NYSE AD line made a
new high with SPX.
Source:
StockChart.com
Figure 10: Percent of stock
in S&P above 200 days moving average which is over 75% stay at a healthy
level.
Source:
StockChart.com
My takeaway is intermediate
term bearish (1-3 month) but long term bullish (1 year) in stock market. Long
term bullish factors includes expanding leading indicator, positive treasury
yield spread, ample liquidity, healthy long term breadth indicators. However, I
still am patient to a take a long position after pullback given a over
optimistic and stretched rally recently.